September 17, 2026
How Does a Live Trading Charts Chrome Extension Display Real-Time Market Data?
1.3k
A
Live Trading Charts Chrome Extension gives traders quick access to market information directly inside their web browser. Instead of switching between several platforms, users can monitor charts, price movements, technical indicators, and market signals from a convenient browser interface.
These extensions connect with market data sources to display updated information as prices change. Depending on the extension and its supported markets, traders may view data for forex, cryptocurrencies, stocks, indices, commodities, and other financial instruments.
The main purpose is to make market monitoring faster and more accessible. A browser-based tool can reduce unnecessary navigation and help users keep important chart information within reach while researching potential trading setups.
How Does Real-Time Market Data Reach the Extension?
A Live Trading Charts Chrome Extension normally depends on a data feed to receive market information. The data source may provide information such as current prices, bid and ask values, trading volume, timestamps, and historical price records.
The extension receives this information through an appropriate connection or application programming interface. It then processes the incoming data and presents it through the chart interface.
When the market changes, new information can replace or update previous values. This process allows the displayed chart to reflect recent market activity without requiring the user to refresh the entire browser page manually.
The exact update speed depends on the provider, data source, market, connection quality, and extension design. Therefore, traders should understand whether an extension provides streaming, delayed, or periodically refreshed information.
How Do Live Charts Update Price Movements?
Live charts update by processing new market data as it becomes available. For example, when a new price arrives, the extension can update the current candle or create a new candle according to the selected timeframe.
A one-minute chart may build candles using one-minute intervals, while a five-minute chart uses five-minute intervals. Longer timeframes organize price information into larger periods.
This organization helps traders observe market behavior without studying every individual price change. The extension can also update visual elements such as:
- Candlestick charts
- Line charts
- Price levels
- Support and resistance areas
- Technical indicators
- Trend lines
- Trading signals
- Volume information
By keeping these elements synchronized with incoming data, the chart provides a clearer view of recent market activity.
Which Technical Features Can a Trading Chart Display?
Modern browser extensions can display more than basic price movements. Depending on their functionality, they may support technical analysis tools that help users examine trends and price structures.
Common features include moving averages, RSI, MACD, Fibonacci levels, trend indicators, volatility measurements, and pattern recognition.
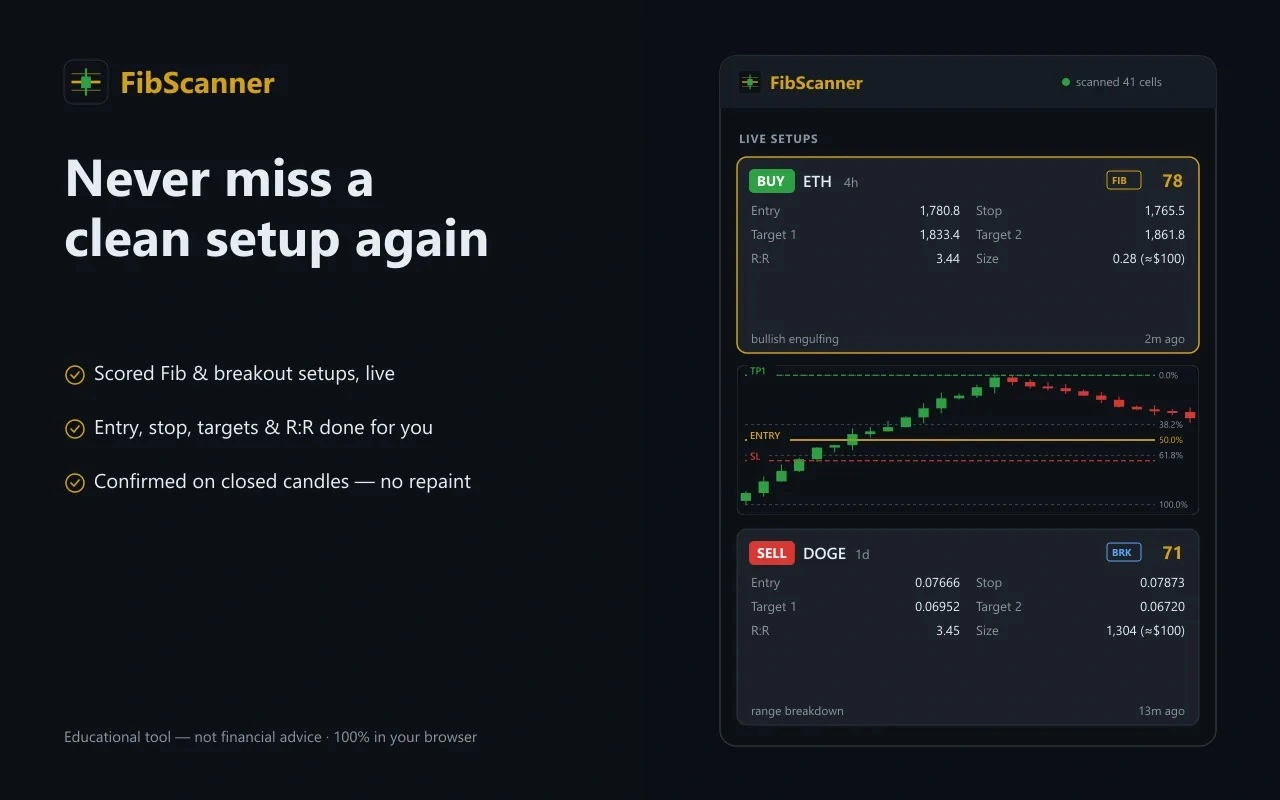
A tool such as Fibonacci Scanner can also focus on Fibonacci-based market analysis. Traders may use Fibonacci levels to study potential retracement and extension areas within a price movement.
However, technical indicators do not guarantee future price movements. Traders should treat chart signals as analytical information rather than guaranteed outcomes.
How Does a Fibonacci Setup Scanner Work With Live Charts?
A
Fibonacci Setup Scanner can help traders locate markets where price action may match predefined Fibonacci conditions. Instead of manually checking many charts, the scanner can examine selected instruments and identify setups that meet its programmed criteria.
For example, a scanner may look for particular swing points, retracement zones, or Fibonacci relationships. Once it detects a matching configuration, it can present the information through the extension or scanner interface.
This approach can save research time when users monitor multiple markets. Instead of opening each chart individually, traders can use scanning functionality to narrow their attention to instruments that match their chosen conditions.
The quality of the result still depends on the scanner's rules and the market data it receives. Users should understand how the scanner identifies a setup before relying on its signals.
Why Is Data Refresh Speed Important?
Fast data updates matter because financial markets can move quickly. A chart that updates slowly may show information that no longer reflects the latest available market activity.
A browser extension can improve convenience by displaying updates without requiring constant manual refreshing. However, traders should distinguish between real-time data and delayed data.
Data providers may apply different update policies to different markets. Some instruments may provide streaming information, while others may have delayed quotes or refresh at specific intervals.
Users should therefore check the extension's data policy and understand the timing of its displayed information before using it for trading decisions.
How Does the Extension Handle Different Timeframes?
Timeframes allow traders to view the same market from different perspectives. A Live Trading Charts Chrome Extension can organize incoming price information into selected intervals.
Short timeframes can show detailed intraday movements, while longer timeframes can make broader trends easier to observe.
For example, traders might compare hourly and daily charts to understand how short-term movements relate to a broader market structure. The extension can recalculate candles and indicators when users change the timeframe.
This flexibility makes chart analysis more practical because traders can adjust the display according to their research method.
Can a Chrome Extension Monitor Multiple Markets?
Many trading tools aim to support multiple instruments from a single interface. A trader may want to monitor forex pairs, cryptocurrencies, indices, stocks, or commodities without opening numerous separate platforms.
A scanner can make this process more efficient by allowing users to select markets and apply specific conditions. The extension then displays relevant information according to its available features.
For users interested in Fibonacci analysis, a Fibonacci Setup Scanner can provide another layer of organization by identifying instruments that meet selected Fibonacci-related conditions.
The number of supported markets depends on the extension, its data providers, and its technical architecture.
How Does Browser Technology Improve Chart Accessibility?
Chrome extensions work within the browser environment, which makes them convenient for users who already conduct market research online. After installation and setup, the tool can provide access to charting or scanning features without requiring a separate desktop application.
This accessibility can be particularly useful for traders who work across different websites during their research process.
Browser extensions can also offer compact interfaces, alerts, watchlists, scanning panels, and chart controls. These features help users organize information while keeping their workflow inside one browser environment.
How Can Traders Use Real-Time Charts Responsibly?
Real-time charts provide information, but they do not remove the uncertainty involved in financial markets. Prices can change rapidly, and technical patterns can produce signals that do not develop as expected.
Traders should verify the information displayed by an extension and understand the source and timing of its data. They should also consider their own risk management approach rather than relying on a single indicator or scanner.
Tools such as Fibonacci Scanner can support market research by helping users organize technical information, but traders should combine scanner results with broader analysis and independent judgment.
What Should You Check Before Using a Trading Chart Extension?
Before using any browser-based trading tool, check several important factors. Confirm which markets it supports and determine whether its data is real-time or delayed. Review the available chart types, indicators, scanning features, and customization options.
You should also examine how the extension handles data updates, whether it requires additional accounts or subscriptions, and what permissions it requests in the browser.
Security also matters. Install extensions from trustworthy sources and review their permissions before granting access.
How Does a Live Trading Charts Chrome Extension Simplify Market Monitoring?
A Live Trading Charts Chrome Extension brings market charts and analytical information into a familiar browser environment. By connecting to market data sources, processing incoming prices, updating charts, and supporting technical tools, it can simplify the process of monitoring multiple instruments.
When combined with features such as a Fibonacci Setup Scanner, the extension can help users identify charts that match specific analytical conditions more efficiently. The result is a streamlined research workflow that reduces repetitive chart checking.
Real-time charting remains a tool for analysis rather than a prediction system. When users understand the data source, update frequency, technical features, and limitations of their extension, they can use browser-based charting more effectively as part of a disciplined market research process.